

tcpdump is the world’s premier network analysis tool—combining both power and simplicity into a single command-line interface. This guide will show you how to use it.
tcpdump is a powerful command-line packet analyzer. It allows you to capture and inspect network traffic in real-time. This tool is invaluable for network administrators, security professionals, and anyone who needs to understand network behavior.
In this tutorial, we’ll explore 50 practical examples of using tcpdump. These examples will cover a wide range of use cases, from basic traffic capture to advanced filtering and analysis.
The basic syntax of tcpdump is:
tcpdump [options] [expression]options: Modify the behavior of tcpdump, such as specifying the interface to capture on or the output format.expression: Defines what kind of traffic to capture. This is where you specify hostnames, IP addresses, ports, protocols, and other criteria.To capture all traffic on a specific interface, use the -i flag followed by the interface name. For example, to capture traffic on the eth0 interface:
tcpdump -i eth0To see a list of all available interfaces, use the command:
tcpdump -DTo capture traffic to or from a specific host, use the host keyword followed by the hostname or IP address:
tcpdump host 192.168.1.100This will capture all traffic to and from the host with the IP address 192.168.1.100.
To capture traffic on a specific port, use the port keyword followed by the port number:
tcpdump port 80This will capture all traffic on port 80 (HTTP).
You can combine filters using and, or, and not operators. For example, to capture all traffic to or from host 192.168.1.100 on port 80, use:
tcpdump host 192.168.1.100 and port 80To capture traffic from 192.168.1.100 on either port 80 or 443, use:
tcpdump src host 192.168.1.100 and ( port 80 or port 443 )To filter by protocol, use the ip, tcp, udp, or other protocol keywords. For example, to capture only TCP traffic:
tcpdump tcpTo capture only UDP traffic:
tcpdump udpTo filter by source or destination host or port, use the src or dst keywords:
tcpdump src host 192.168.1.100This will capture all traffic from the host 192.168.1.100.
tcpdump dst port 443This will capture all traffic destined for port 443.
To capture traffic within a specific network, use the net keyword:
tcpdump net 192.168.1.0/24This will capture all traffic within the 192.168.1.0/24 network.
To save captured traffic to a file, use the -w flag followed by the filename:
tcpdump -w capture.pcap -i eth0This will save all captured traffic on the eth0 interface to the file capture.pcap.
You can later analyze this file using tcpdump or another packet analyzer like Wireshark.
To read captured traffic from a file, use the -r flag followed by the filename:
tcpdump -r capture.pcapThis will read and display the traffic from the file capture.pcap.
You can control the verbosity of tcpdump output using the -v, -vv, or -vvv flags.
-v: Verbose output.-vv: More verbose output.-vvv: Most verbose output.For example:
tcpdump -vv -i eth0Here are 50 tcpdump examples to help you isolate traffic in various situations:
eth0:
tcpdump -i eth0wlan0:
tcpdump -i wlan0192.168.1.100:
tcpdump host 192.168.1.100example.com:
tcpdump host example.comtcpdump port 80tcpdump port 443tcpdump port 22tcpdump port 21tcpdump port 25tcpdump port 53192.168.1.100:
tcpdump src host 192.168.1.100192.168.1.100:
tcpdump dst host 192.168.1.100tcpdump src port 80tcpdump dst port 443tcpdump tcptcpdump udptcpdump icmp192.168.1.0/24:
tcpdump net 192.168.1.0/24192.168.1.0/24:
tcpdump src net 192.168.1.0/24192.168.1.0/24:
tcpdump dst net 192.168.1.0/24192.168.1.100 on port 80:
tcpdump dst host 192.168.1.100 and dst port 80192.168.1.100 on port 443:
tcpdump src host 192.168.1.100 and src port 443192.168.1.100 on port 80 or 443:
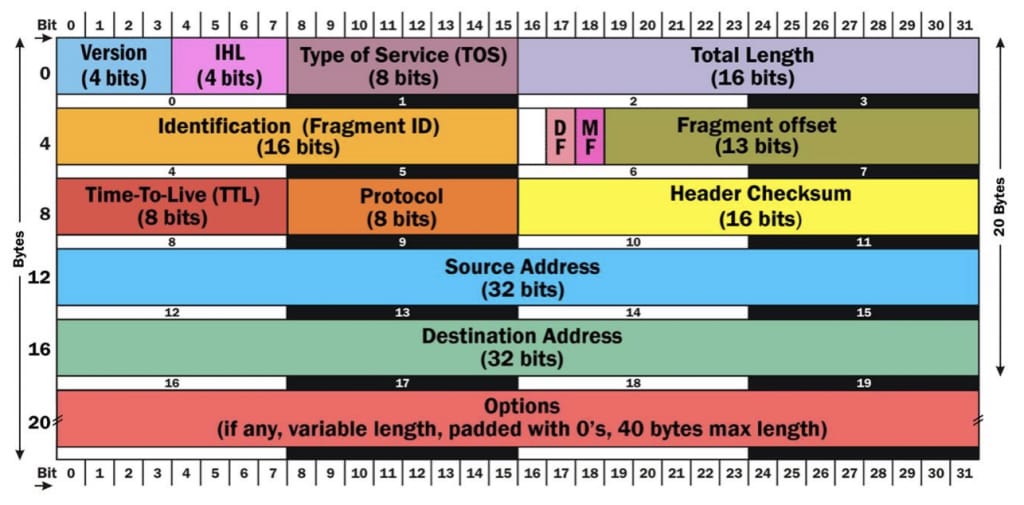
tcpdump host 192.168.1.100 and ( port 80 or port 443 )tcpdump not icmptcpdump not port 80tcpdump 'tcp[tcpflags] & tcp-syn != 0'tcpdump 'tcp[tcpflags] & tcp-ack != 0'tcpdump 'tcp[tcpflags] & tcp-rst != 0'tcpdump 'tcp[tcpflags] & tcp-fin != 0'tcpdump 'tcp[tcpflags] & tcp-urg != 0'tcpdump 'tcp[tcpflags] & tcp-push != 0'tcpdump 'tcp[tcpflags] = 0x01'tcpdump 'tcp[tcpflags] = 0x00'tcpdump 'tcp[tcpflags] = 0x12'tcpdump 'tcp[tcpflags] = 0x14'tcpdump 'tcp[tcpflags] = 0x11'tcpdump 'tcp[tcpflags] = 0x18'tcpdump 'ip[6:2] & 0x1fff != 0'tcpdump 'ip[8] = 128'tcpdump 'ip[1] & 0xfc >> 2 = 46'tcpdump 'ip[1] & 0x03 = 3'tcpdump 'tcp[4:4] = 12345678'tcpdump 'tcp[8:4] = 87654321'tcpdump 'tcp[0:2] > 1023 and tcp[0:2] < 65536'tcpdump 'tcp[2:2] > 1023 and tcp[2:2] < 65536'These examples should provide a solid foundation for using tcpdump to analyze network traffic.
Happy hunting!
-Daniel
Having studied Spanish for over 6 years, I knew what dulce de leche meant. Sweet.…
I found kiwis on sale. Five for $1! In the middle of winter. In January.…
An experience. That’s what Ghirardelli is to me. For many years, San Francisco was a…
The challenge: Bring something with a foraged ingredient. My answer: Eucalyptus. Eucalyptus ice cream! Large…
Celery ice cream? It got me thinking. Celery? Green. Usually eaten raw. Almost tasteless, but…
“A cookie must melt at the same rate as the ice cream,” an ice cream…
Leave a Comment